A rider in Leh in January and a rider in Nagpur in May are facing very different conditions, yet both ride on the same kind of battery. India has some of the widest temperature differences of any large electric vehicle market, so the effect of temperature on electric vehicles in India is a question every rider, fleet owner and manufacturer eventually asks.
This guide explains the effect of temperature on electric vehicles in India by looking at how heat and cold change range, efficiency and emissions across Indian regions, with heat maps of temperature and air quality, energy use against temperature, and practical advice. A free PDF version is also available to download.
Prefer to Read Offline? Download the Free PDF
Get the full 15-page report with the heat maps, energy use data, regional playbook and a state-by-state data table.
Download the Free PDFKey findings
- Range is highest between about 15 and 35 °C. The model keeps about 85% of range at 5 °C and about 94% at 40 °C.
- For most Indians the effect of temperature on electric vehicles is modest: about 89% range retained on a Delhi winter morning, 96% in Hyderabad and 100% in Chennai.
- The Himalayan belt is where it matters: about 76% in Srinagar and 59% in Leh on a typical January morning.
- Emissions stay lower even in the cold: about 34 g of CO2 per km at 5 °C against about 51 g for a petrol two-wheeler.
- The cold north is also the most polluted north, so the local air quality gain from electric two-wheelers is largest there.
About the data. Temperature and air quality values are rounded and indicative, and the range curve is an illustrative engineering model, not Gravton test data. See the notes at the end.
The Effect of Temperature on Electric Vehicles in India: Why It Matters
An electric vehicle is a chemical device that happens to move. In the cold, the battery’s electrolyte becomes more resistant, less energy is available and charging is limited to protect the cells. In extreme heat, reactions speed up, ageing accelerates and the battery management system may cut power to protect the pack, which engineers call thermal derating. Motors and controllers also lose efficiency when hot, and cold air is denser, which raises drag and rolling resistance.
Electric two-wheelers have no cabin to heat or cool, so their temperature effects come mostly from the battery and drivetrain. That is one reason the swings here are smaller than figures often quoted for cars. The effect of temperature on electric vehicles in India also depends on chemistry: LFP and LMFP cells are valued for thermal stability but tend to lose more usable capacity in the cold than nickel-based cells.
India’s Temperature Map: Heat and Cold

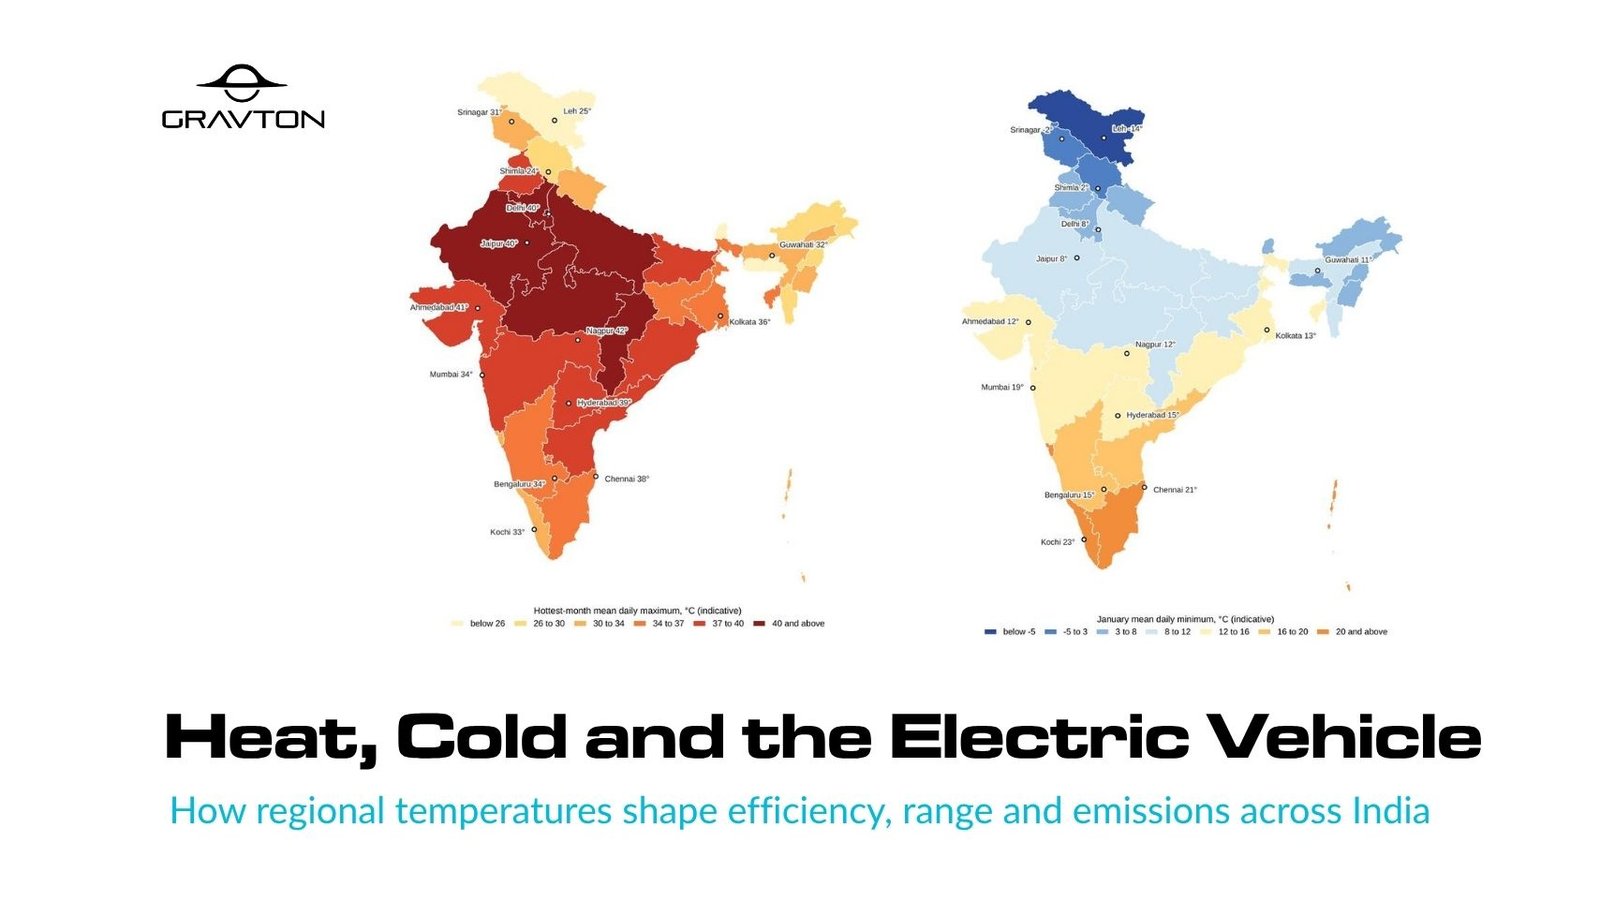
The effect of temperature on electric vehicles in India starts with geography. The hottest belt runs across Rajasthan, Madhya Pradesh, Gujarat, Chhattisgarh and Uttar Pradesh, where hottest-month afternoons sit around 40 °C and above. Coastal and southern states are milder, and the Himalayan states stay cool even in summer.

Most of peninsular India stays warm through winter. The northern plains see single-digit mornings, and Ladakh drops well below freezing. Cold in India is mostly a morning problem, so the effect is concentrated in early riding, in the hills and at altitude.
Effect of Temperature on Electric Vehicle Range and Energy Use
To make the effect of temperature on electric vehicles in India concrete, we built a simple model for a typical electric two-wheeler using 35 Wh per km at 25 °C.

| Temperature | Range retained | Energy use (Wh per km) | Energy cost per km (₹ at ₹8 per kWh) |
|---|---|---|---|
| -10 °C | 65% | 53.8 | 0.48 |
| 0 °C | 79% | 44.3 | 0.39 |
| 5 °C | 85% | 41.2 | 0.37 |
| 10 °C | 91% | 38.5 | 0.34 |
| 25 °C | 100% | 35.0 | 0.31 |
| 40 °C | 94% | 37.2 | 0.33 |
| 45 °C | 90% | 38.9 | 0.35 |
Assumes 90% charging efficiency. Petrol at ₹115 per litre and 45 km per litre costs about ₹2.56 per km for comparison.
Even at 5 °C, energy use per kilometre rises by roughly one sixth, which adds only a few paise to each kilometre. The practical effect is less range available on a cold morning, which matters most to riders who use most of the battery in a day. For habits that stretch every charge, read our guide to maximising EV bike battery range.
Region by Region: Where the Effect of Temperature on Electric Vehicles in India Matters

| Region | Winter morning range retained | Hot afternoon range retained | Main effect |
|---|---|---|---|
| Northern plains | 86 to 90% | 93 to 96% | Heat in summer, cold winter mornings and the highest pollution levels |
| Hot and dry west and centre | 89 to 93% | 93 to 94% | Prolonged peak heat, so cooling and thermal derating matter most |
| Deccan and southern plateau | 95 to 98% | 94 to 96% | Warm all year, with April and May the main heat stress |
| Coastal and humid tropics | 89 to 100% | 96 to 99% | Warm and humid, so temperature has the smallest effect |
| Himalayan cold | 59 to 84% | 99 to 100% | Cold and altitude dominate, so winter range and cold charging need planning |
| North-east hills | 86 to 93% | 97 to 100% | Mild temperatures, so gradients and rain matter more than temperature |
Ranges show the spread across states in each group, using indicative values and the illustrative model.
Emissions and Air Quality: The Effect of Temperature on Electric Vehicles in India
An electric vehicle has no tailpipe emissions, which improves the air people breathe, and the electricity it uses carries emissions that depend on the grid.

The Indo-Gangetic Plain, from Punjab and Haryana through Delhi, Uttar Pradesh and Bihar, shows the highest indicative levels. For comparison, the Indian annual standard for PM2.5 is 40 µg/m3 and the World Health Organization’s 2021 guideline is 5 µg/m3.

At 25 °C the electric two-wheeler emits about 29 g of CO2 per km, a reduction of roughly 43% against petrol. At 5 °C it is about 34 g, still about 33% lower. The gap narrows only in very cold conditions with a coal-heavy grid, and it widens as the grid adds renewable power. Manufacturing emissions are not included.
What Riders and Fleets Can Do
- In hot weather: park in shade and avoid charging a hot battery straight after a long ride.
- In cold weather: charge indoors, charge before the battery has cooled overnight and expect less range on the first ride of the day.
- Plan a buffer: plan with about 25% less than claimed range, and more in the cold or with a heavy load.
- Fleets: to understand the effect of temperature on electric vehicles in your own routes, use telematics to compare energy use per km across seasons. Gravton’s GOTAC platform includes battery analytics for this. Schedule heavy routes for milder hours.
- Ask the manufacturer about range at 5 °C and 40 °C, cold-charging limits, pack insulation and warranty terms for extremes.
For safe charging habits, see electric vehicle charge time, cost and battery life tips and our guide to electric two-wheeler charging in India.
Real conditions, real range. The Gravton Quanta completed what the company describes as the first and only electric two-wheeler journey from Kanyakumari to Khardung La: 4,011.9 km across 11 states in 6.5 days, reaching about 18,000 ft. No controlled temperature data from that ride is presented here, so we draw no conclusions about temperature effects from it.
Download the Free Report
Get the full 15-page PDF on the effect of temperature on electric vehicles in India, with the heat maps, energy use data, regional playbook and a state-by-state data table.
Download the PDFExplore GravtonFrequently Asked Questions
How does temperature affect electric vehicles in India?
The effect of temperature on electric vehicles in India is mixed. Cold raises the battery's internal resistance, so less energy is available and energy use per kilometre rises. Extreme heat can trigger thermal derating and speeds up battery ageing. Across most of India the effect is modest, and it is largest in cold Himalayan regions and during the hottest afternoons.
How much range does an electric two-wheeler lose in cold weather?
In our illustrative model, a typical electric two-wheeler keeps about 85% of its range at 5 °C, 79% at 0 °C and 65% at -10 °C. Real figures depend on the vehicle, battery chemistry and thermal design.
Does heat reduce electric vehicle range in India?
Yes, but by less than cold in most cases. The model shows about 94% of range retained at 40 °C and about 90% at 45 °C, mainly through higher energy use and thermal derating.
Which parts of India are hardest on electric vehicles?
The Himalayan belt in winter, because of sub-zero mornings and altitude, and the hottest plains in April to June, including Rajasthan, Madhya Pradesh, Gujarat and Uttar Pradesh, because of sustained heat.
Do electric vehicles still cut emissions in cold weather?
In our model, yes. An electric two-wheeler emits about 29 g of CO2 per km at 25 °C and about 34 g at 5 °C, against about 51 g for a petrol two-wheeler at 45 km per litre, assuming a grid factor of 0.75 kg CO2 per kWh. Operational emissions only.
Where does an electric two-wheeler help air quality the most?
In the northern plains, from Punjab and Haryana through Delhi, Uttar Pradesh and Bihar, which show the highest indicative PM2.5 levels. Replacing petrol two-wheelers there removes tailpipe emissions where people live.
How should I charge an electric bike in hot or cold weather?
In heat, park in shade and let a hot battery cool before charging. In cold, charge indoors and before the battery has cooled overnight. Use the manufacturer's charger on a properly earthed socket.
Is this data measured or modelled?
The temperature and PM2.5 figures are rounded, indicative values, and the range curve is an illustrative engineering model. They show patterns and are not measured test data. Verify against IMD and CPCB data before relying on any figure.
About this article. This piece on the effect of temperature on electric vehicles in India is published by Gravton Motors, Hyderabad, an electric two-wheeler manufacturer, so Gravton details are manufacturer-provided. Temperature and PM2.5 values are rounded and indicative, and the range curve is an illustrative model. Verify against India Meteorological Department climate normals and Central Pollution Control Board data before relying on any figure. Maps are illustrative and not an authoritative depiction of boundaries.
Website: www.gravton.com | Email: connect@gravtonmotors.com | Phone: 7995252220
Disclaimer: This article is published by Gravton Motors Pvt. Ltd. for general informational purposes only. The insights, opinions, estimates and recommendations shared here are illustrative, may not apply to every vehicle, location or situation, and do not constitute professional, technical, legal or financial advice. While we aim to be accurate, Gravton Motors makes no guarantee of the accuracy, completeness or timeliness of the content and cannot be held responsible for any loss, damage or inconvenience arising from reliance on it. Always refer to your vehicle's owner's manual and consult the manufacturer or a qualified professional before acting. References to third-party organisations and links are provided for convenience and do not imply endorsement.